Welcome to the world of solar energy monitoring with the GoodWe SEMS app! In this easy-to-follow guide, we’ll walk you through the basics of reading and understanding the crucial data provided by your app, or you can watch the video below.
Getting Started
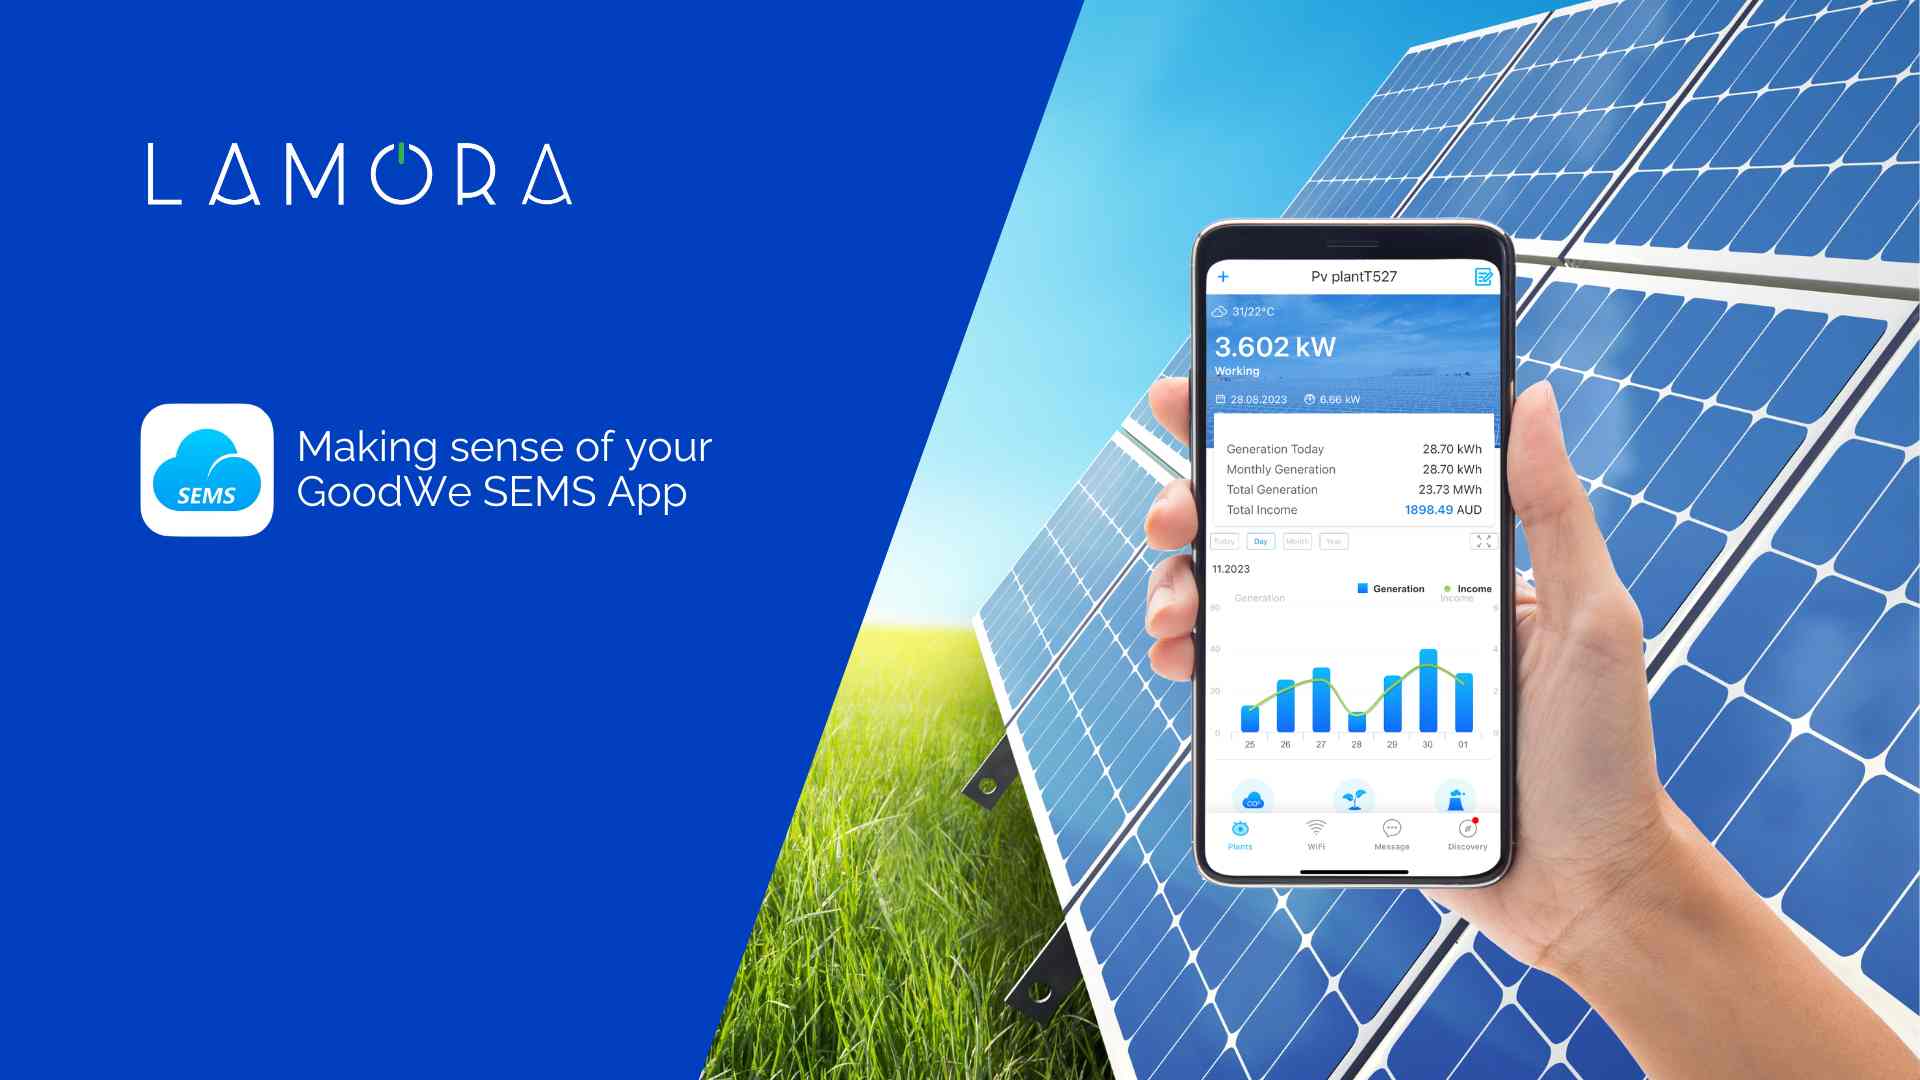
Upon opening the GoodWe SEMS app, the initial screen will display key information about your solar system’s performance. Let’s break down the essential elements:
- PV (Photovoltaic) Energy: The top number represents the current amount of energy your system is producing.
Understanding Your Solar Data
Move your gaze just above the graph to find a wealth of information:
- Generation Today: This indicates the amount of energy your system has produced on the current day.
- Monthly Generation: Reflects the total energy generated throughout the current month.
- Total Generation: Displays the overall energy production since the installation of your solar system.
- Total Income: An estimate of the value of your total generation if it were all to be fed back into the grid.
Analysing the Daily Production Graph
Beneath these figures, you’ll find a daily production graph that illustrates your system’s energy production at different times throughout the day. Let’s explore:
- Sunny Day Example: A sunny day typically exhibits a consistent graph pattern.
- Rainy Day Example: On a rainy day, the graph may show fluctuations in energy production.
Examining Performance Over Time
Switch to the day view to analyse your system’s performance over the last seven days. Peaks suggest sunny days with optimal production, while troughs indicate cloudy or rainy weather.
Adjusting Feed-in Tariffs for Accuracy
For more accurate income data, follow these steps:
- Tap the edit button in the top right corner.
- Scroll down to the profit ratio.
- Enter your solar feed-in tariff.
For precision, consider using a percentage of your feed-in rate. For instance, if you use 30% of your solar and feed in the remaining 70%, set your feed-in rate accordingly. This will give you a better indication of what your solar is really worth to you in solar feed-in credits.
Conclusion
Thank you for joining us on this walkthrough of the GoodWe SEMS app. We hope you found this guide helpful in navigating your solar data.